

One of the most important aspects of creating a map that effectively communicates information is an appropriately chosen color scheme. Colors used in a map are instrumental in displaying trends or relationships, and they ultimately impact how your map is perceived. Color selection is particularly important when choosing color ramps, which apply a continuous range of colors to a group of symbols on your map. ArcMap has predefined color ramps and gives you the option to create your own. Choosing colors is not easy for all of us, which is why ColorBrewer, a web tool for selecting colors for maps, is so useful. ColorBrewer facilitates the process of creating and testing customized, intelligent color selections based on the nature of your data.
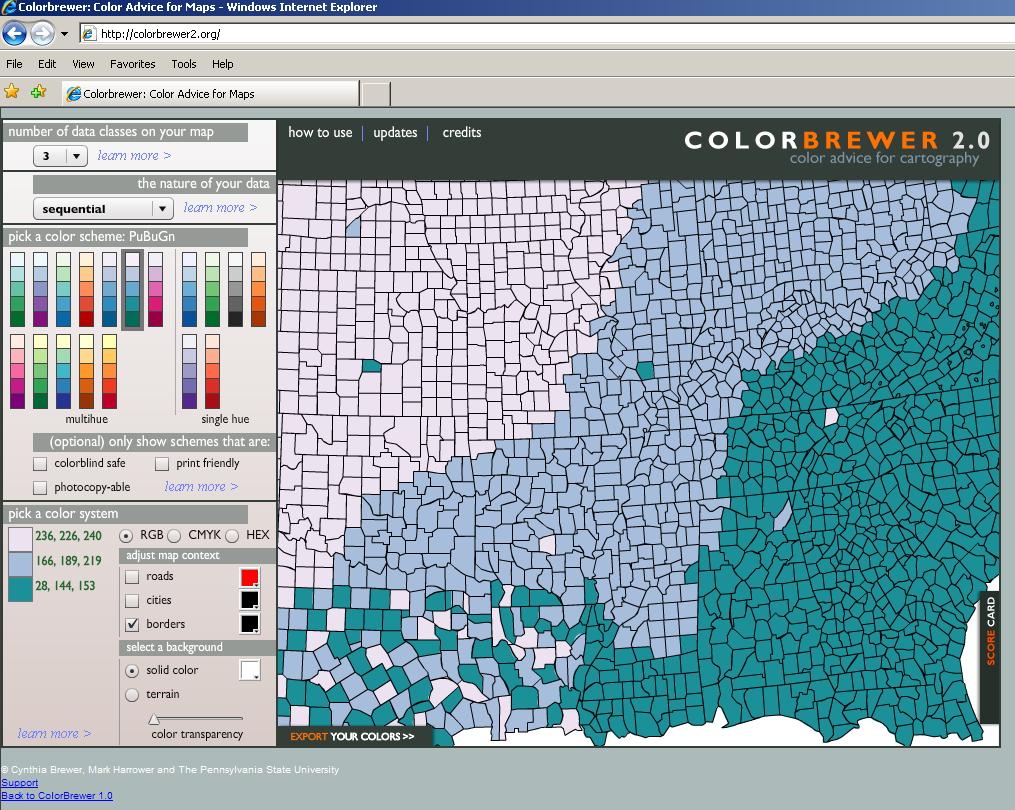
An updated version, ColorBrewer 2.0, was recently released by Axis Maps. The new version has a larger selection of colors to customize the symbology of map features, including roads, cities, and boundary lines. You can also turn on a hillshade layer in the background and use transparency settings to see how well color schemes function as transparent overlays. Another new feature of ColorBrewer 2.0 is the ability to filter color schemes based on colorblind-safe, print-friendly, or photocopy-friendly settings so you can select which ones are suitable for the intended use of your map. The new version also allows you to export your color schemes into Adobe Illustrator, Photoshop, or Excel. Perhaps, the best feature of the new version is the ability to download an ArcMap plug-in, called ColorTool, which allows you to directly apply ColorBrewer color ramps to your own maps. Check back next Tuesday for more information on this free plug-in!
Note: ColorBrewer 2.0 requires Adobe Flash Player 10. If you can’t download Adobe Flash Player 10, the original version of ColorBrewer is still available.
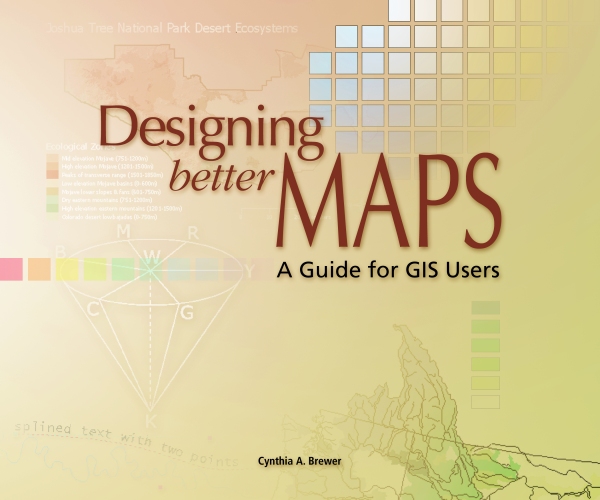
ColorBrewer’s creator, Cynthia A. Brewer, is the author of Designing Better Maps: A Guide for GIS Users, which is available in the general stacks of Fondren Library. In addition to detailed information about map design, the book includes an appendix describing the ColorBrewer application, as well as printed color charts.
For hands-on training, Rice students, staff, and faculty have free access to ESRI’s online course, titled Cartographic Design Using ArcGIS 9, which was authored by Dr. Brewer. Two of the seven modules in the course relate specifically to color design. Those wishing to take the self-paced, online course may log a ticket with Rice IT to request a course access code. Anyone may also purchase access to the course for $174.